At times when troubleshooting rare or unique issues, gathering specific details is crucial for resolving the problem effectively. In such instances, we may kindly request your assistance in providing comprehensive information regarding the error you're encountering.
Here's a helpful checklist of details that will greatly assist us in pinpointing and resolving the issue:
- ID of the Project/Experiment/Task/Inventory where you encountered an error
- e.g., TA231, PR13, IN651
- Username of the user that ran into an error
- The name and email address linked to your SciNote user record
- Time Stamp (down to the minute) of when the issue happened
- e.g., the error occurred on 12/13/2024 at 09:42
- Screenshots (or video capture) of the error and any steps that you take (before/after) to replicate the issue within SciNote
- Browser information (Chrome/Firefox/Safari) and OS (Windows, MacOS)
- Identify the web browser & operating system (OS) you use to access SciNote
- Web Browser logs (see section below to learn how to collect browser logs)
How to collect browser logs
Browser logs show us some communication between your web browser and the SciNote server. With logs you provide, we can see any errors that show us what might be causing the issue.
The Console (your browser Dev Tools) starts capturing data only after it is activated so it is important to have it open before you start replicating the issue in SciNote.
*The most useful format to send in your browser logs is a video recording of your Console and the steps you take to recreate the error you see in SciNote.
Watch this example video of how to collect browser logs in Google Chrome
Instructions for Collecting Logs for each Web Browser
Mozilla Firefox:
- Open browser console by navigating to
 Menu button and clicking on More tools and then opening Web Developer Tools. (You can also use keyboard shortcut by holding down Ctrl+Shift and then pressing letter i.)
 - When (after) the console windows is open, then start your video recording and try to replicate the steps that bring you up to the issue in SciNote. Console logs should be now gathered in the background.
- Navigate to the Console tab in the console window and provide us a video/screenshot of the logs:
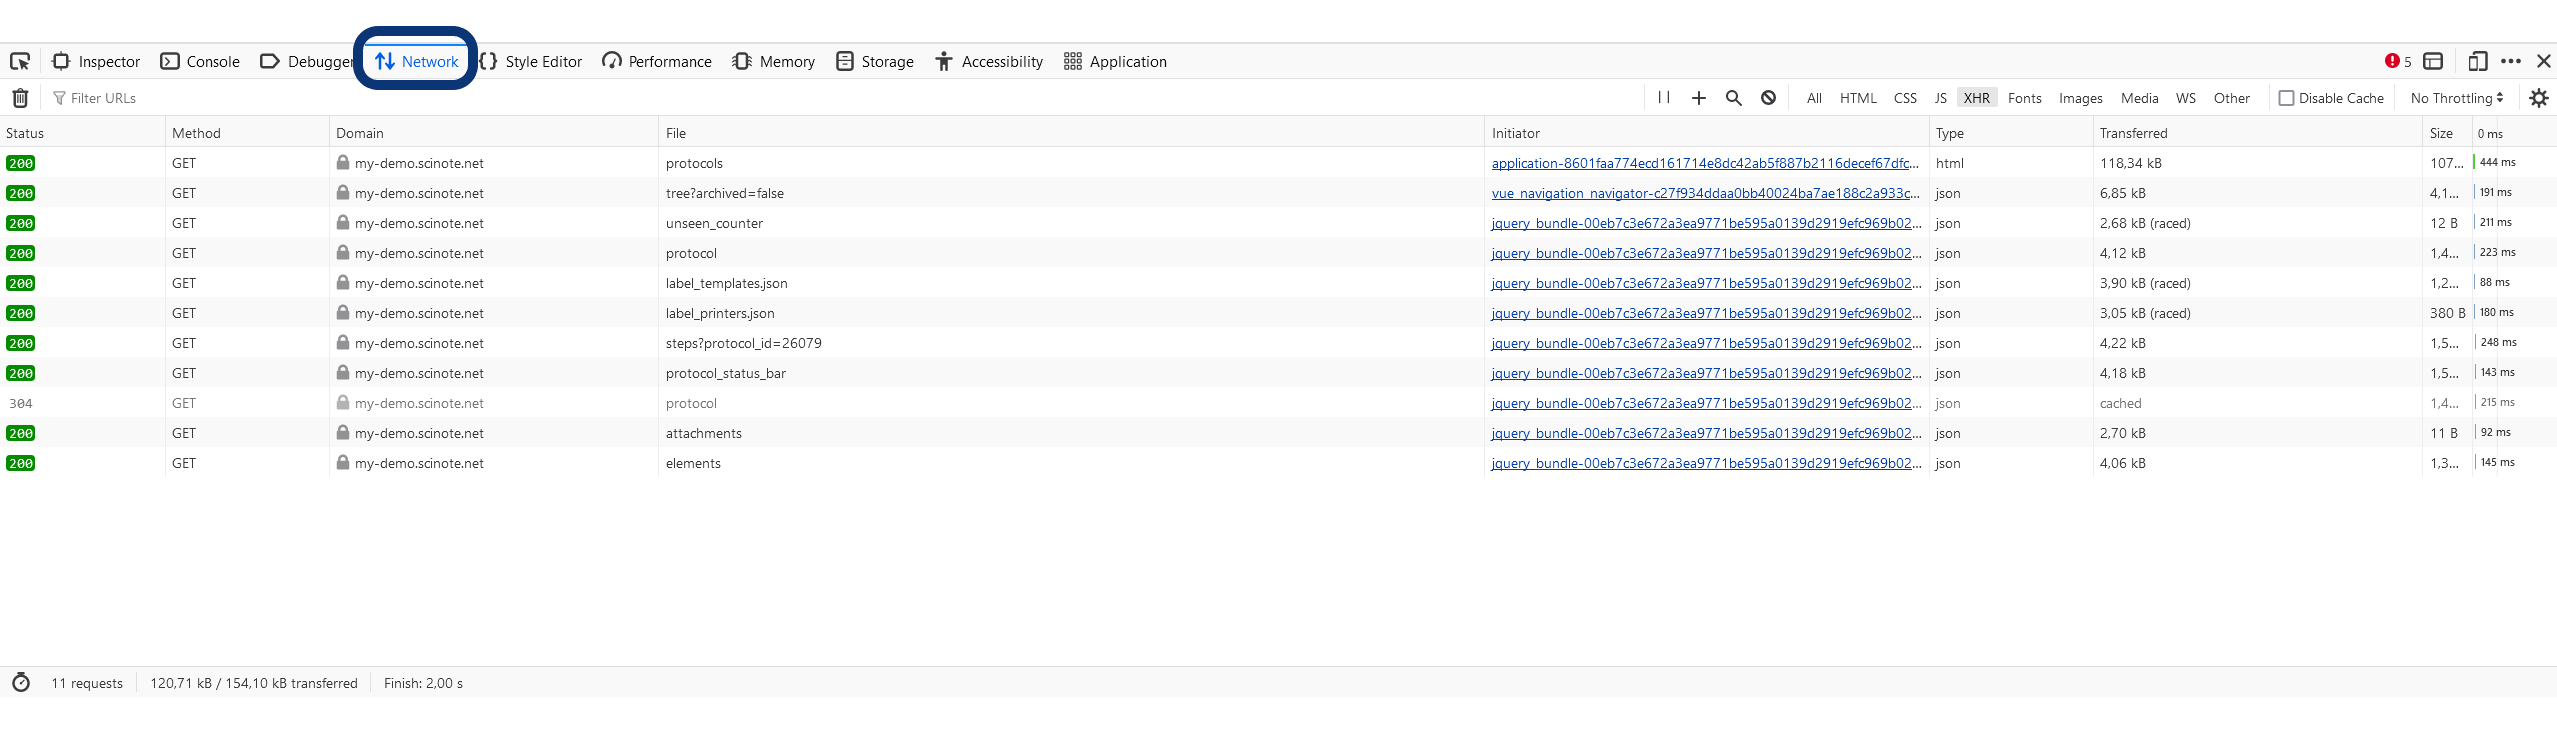
- Navigate to the Network tab in the console window and provide us a video/screenshot of the logs. You can also resize the window to capture as many logs in the screenshot as you can.
Google Chrome:
- Open browser console by navigating to
 Menu button and clicking on More tools and then opening Developer Tools. (You can also use keyboard shortcut by holding down Ctrl+Shift and then pressing letter i.)
 - When (after) the console windows is open, then start your video recording and try to replicate the steps that bring you up to the issue in SciNote. Console logs should be now gathered in the background.
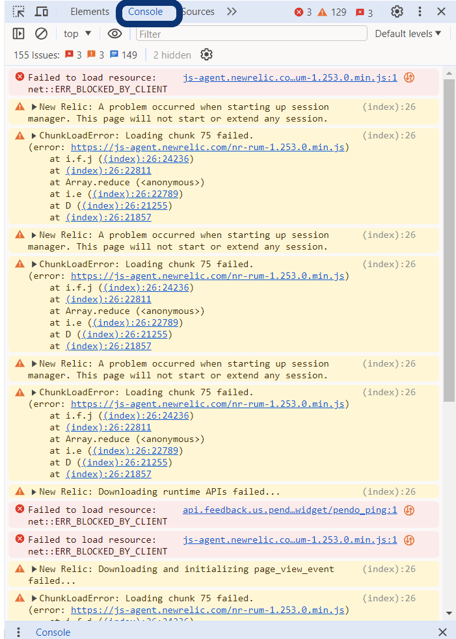
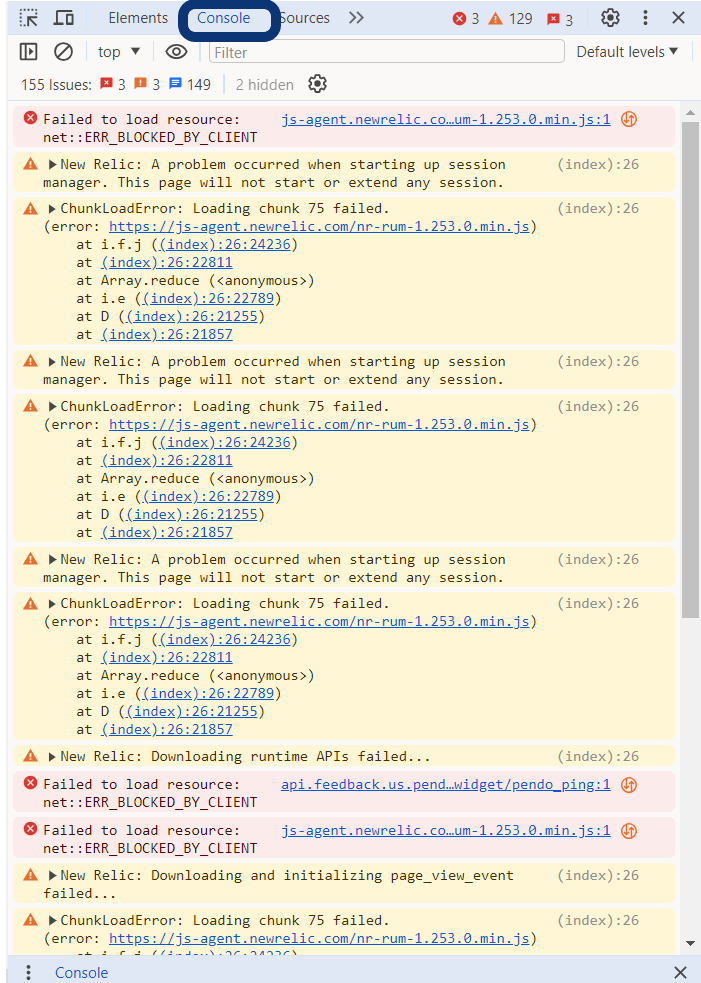
- Navigate to the Console tab in the console window and provide us a video/screenshot of the logs:
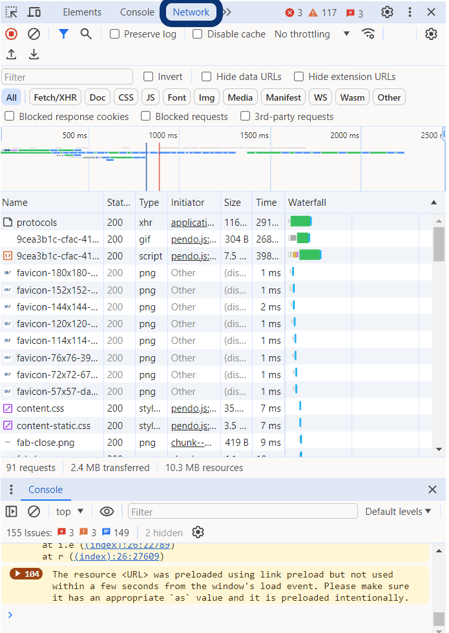
- Navigate to the Network tab in the console window and provide us a video/screenshot of the logs. You can also resize the window to capture as many logs in the screenshot as you can.

Safari:
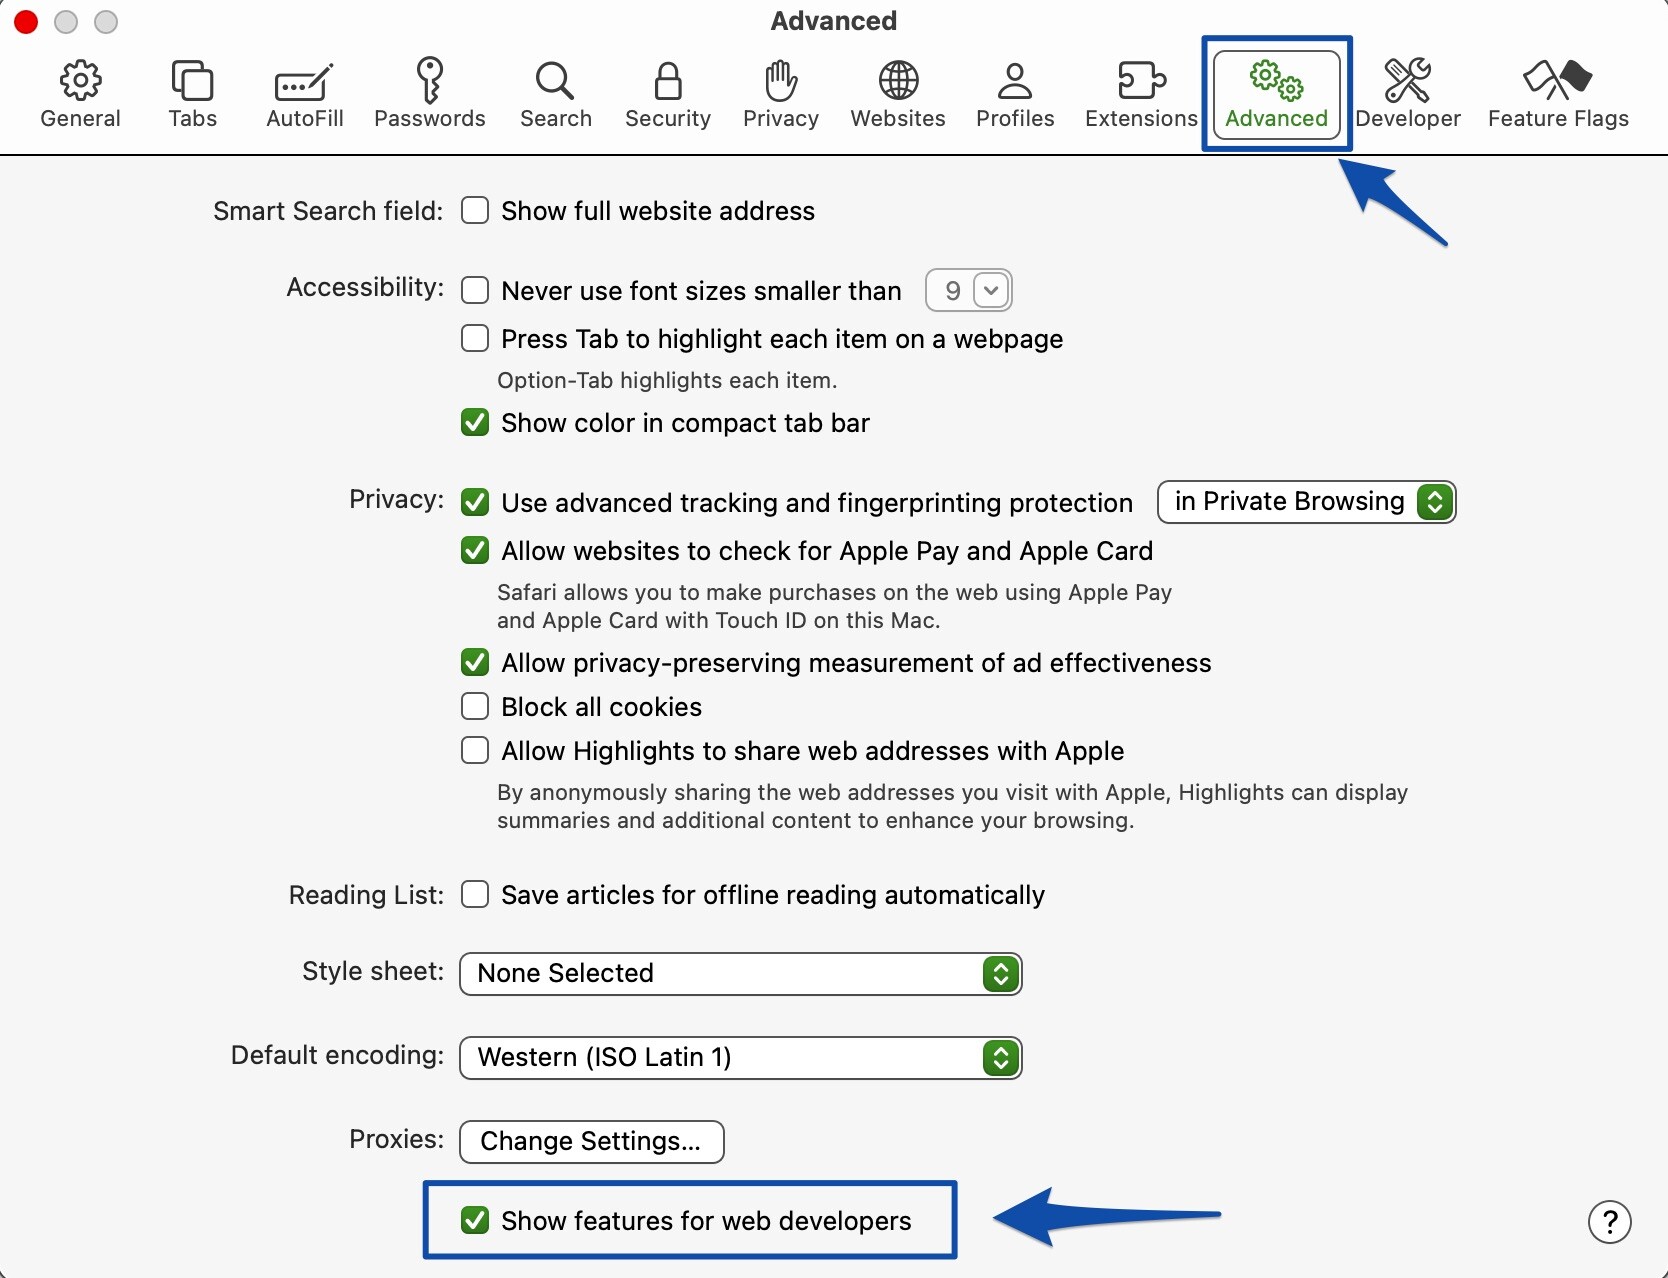
- If you don’t see the Develop menu in your Safari menu bar, choose Safari > Settings, click Advanced, then select “Show features for web developers.”
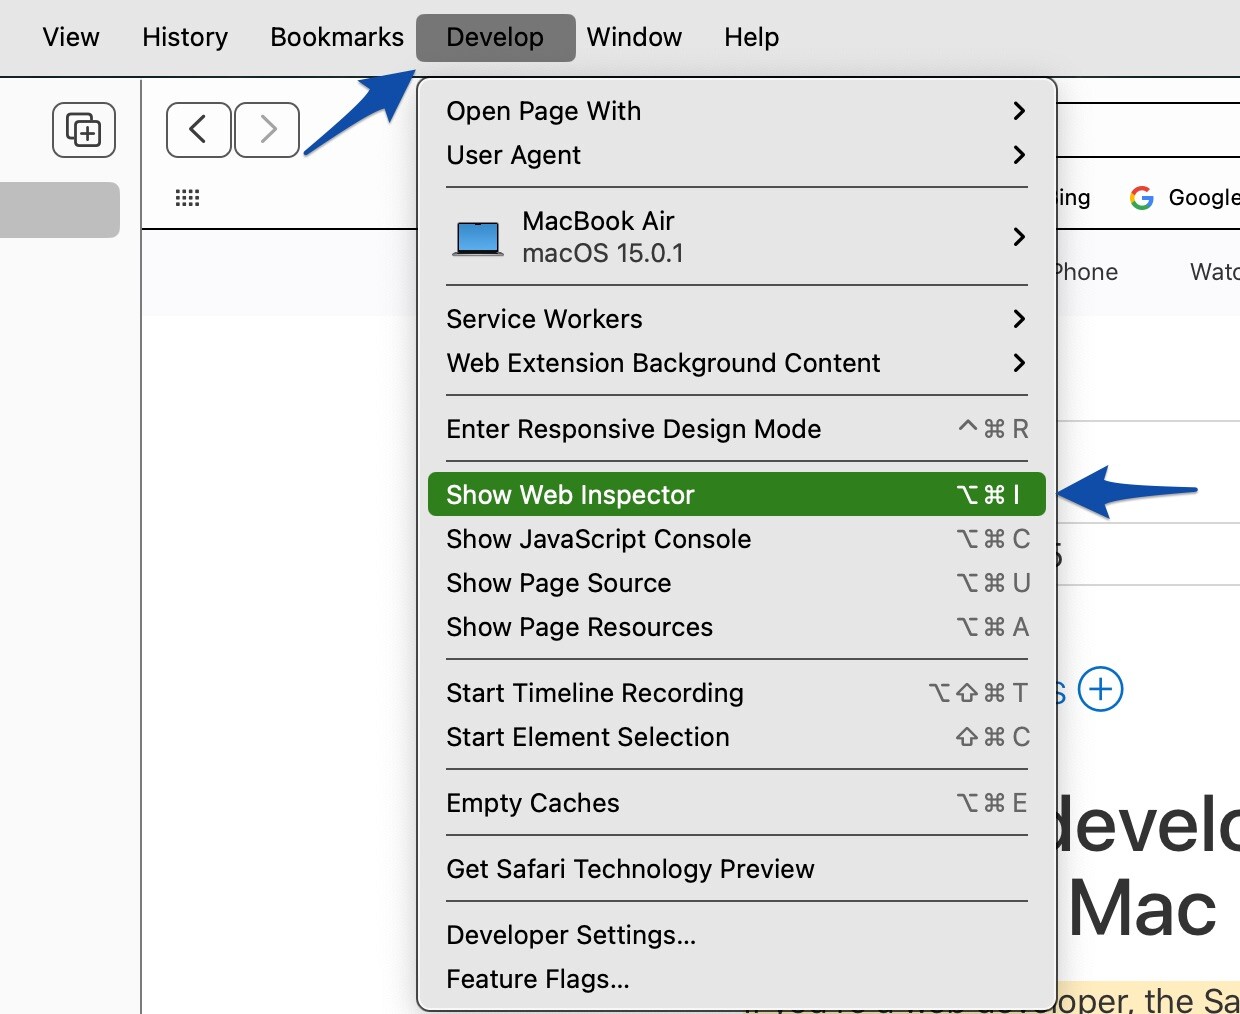
- At the top of your Safari browser, over the developer console by navigating to Develop and clicking on Show Web Inspector (You can also use keyboard shortcut by holding down Option+Command and then pressing letter i.)

- When (after) the console windows is open, then start your video recording and try to replicate the steps that bring you up to the issue in SciNote. Console logs should be now gathered in the background.
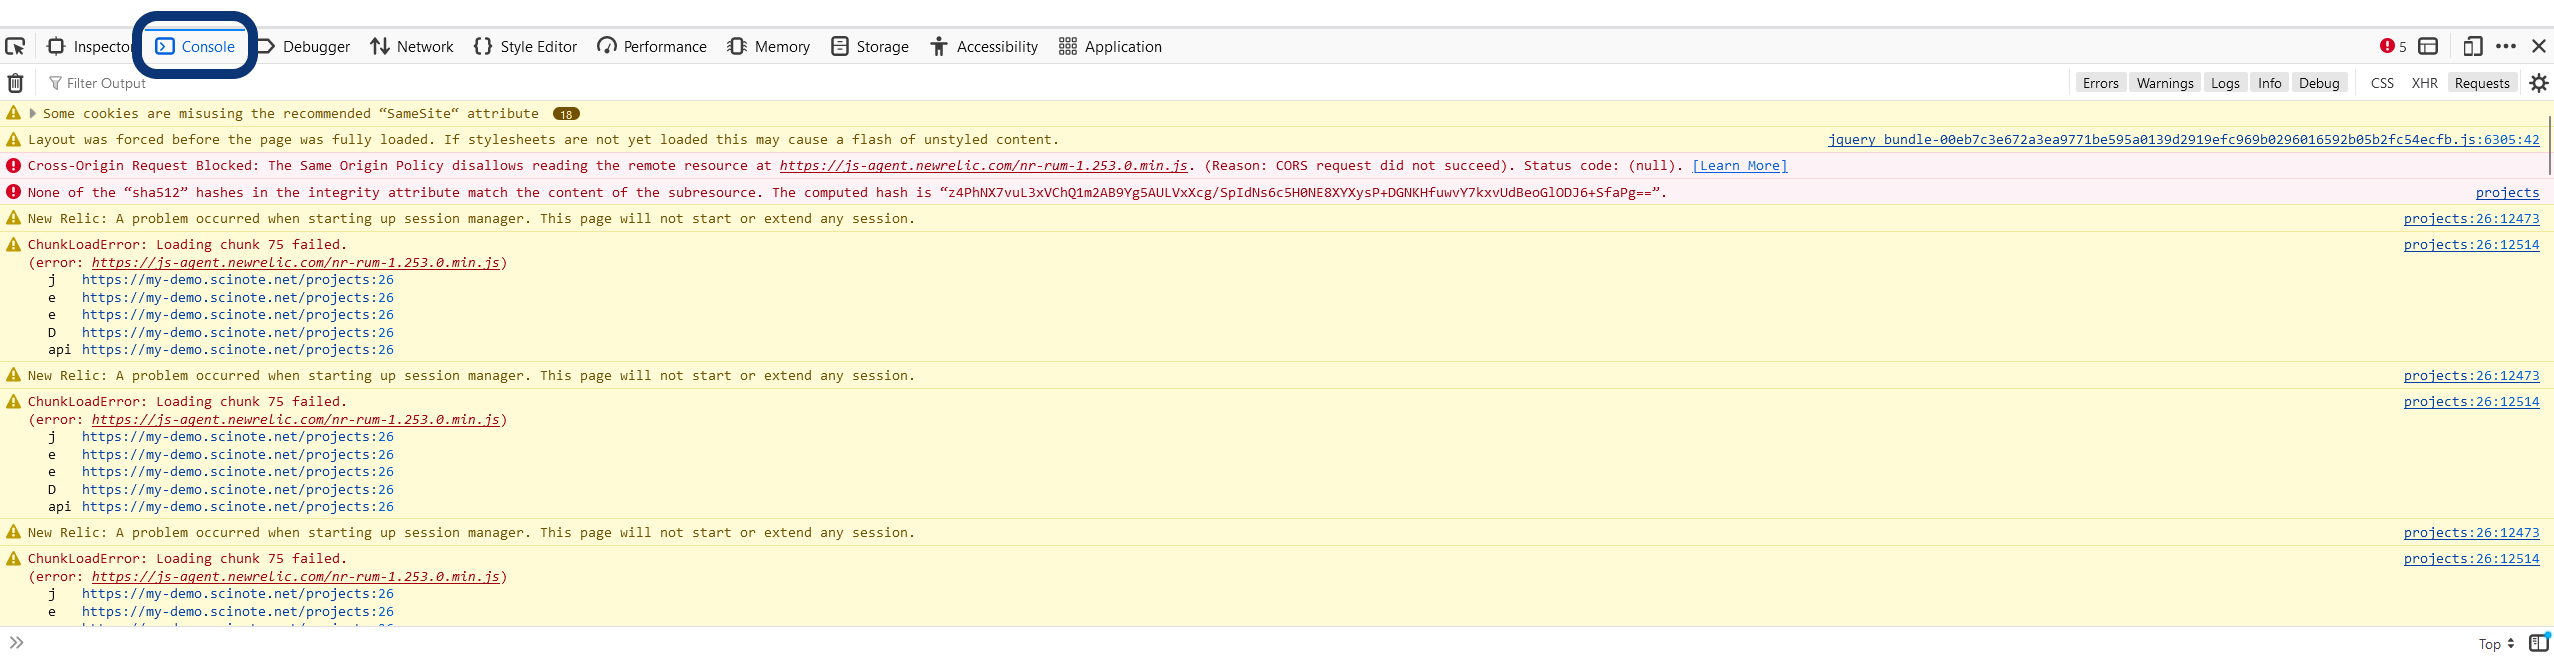
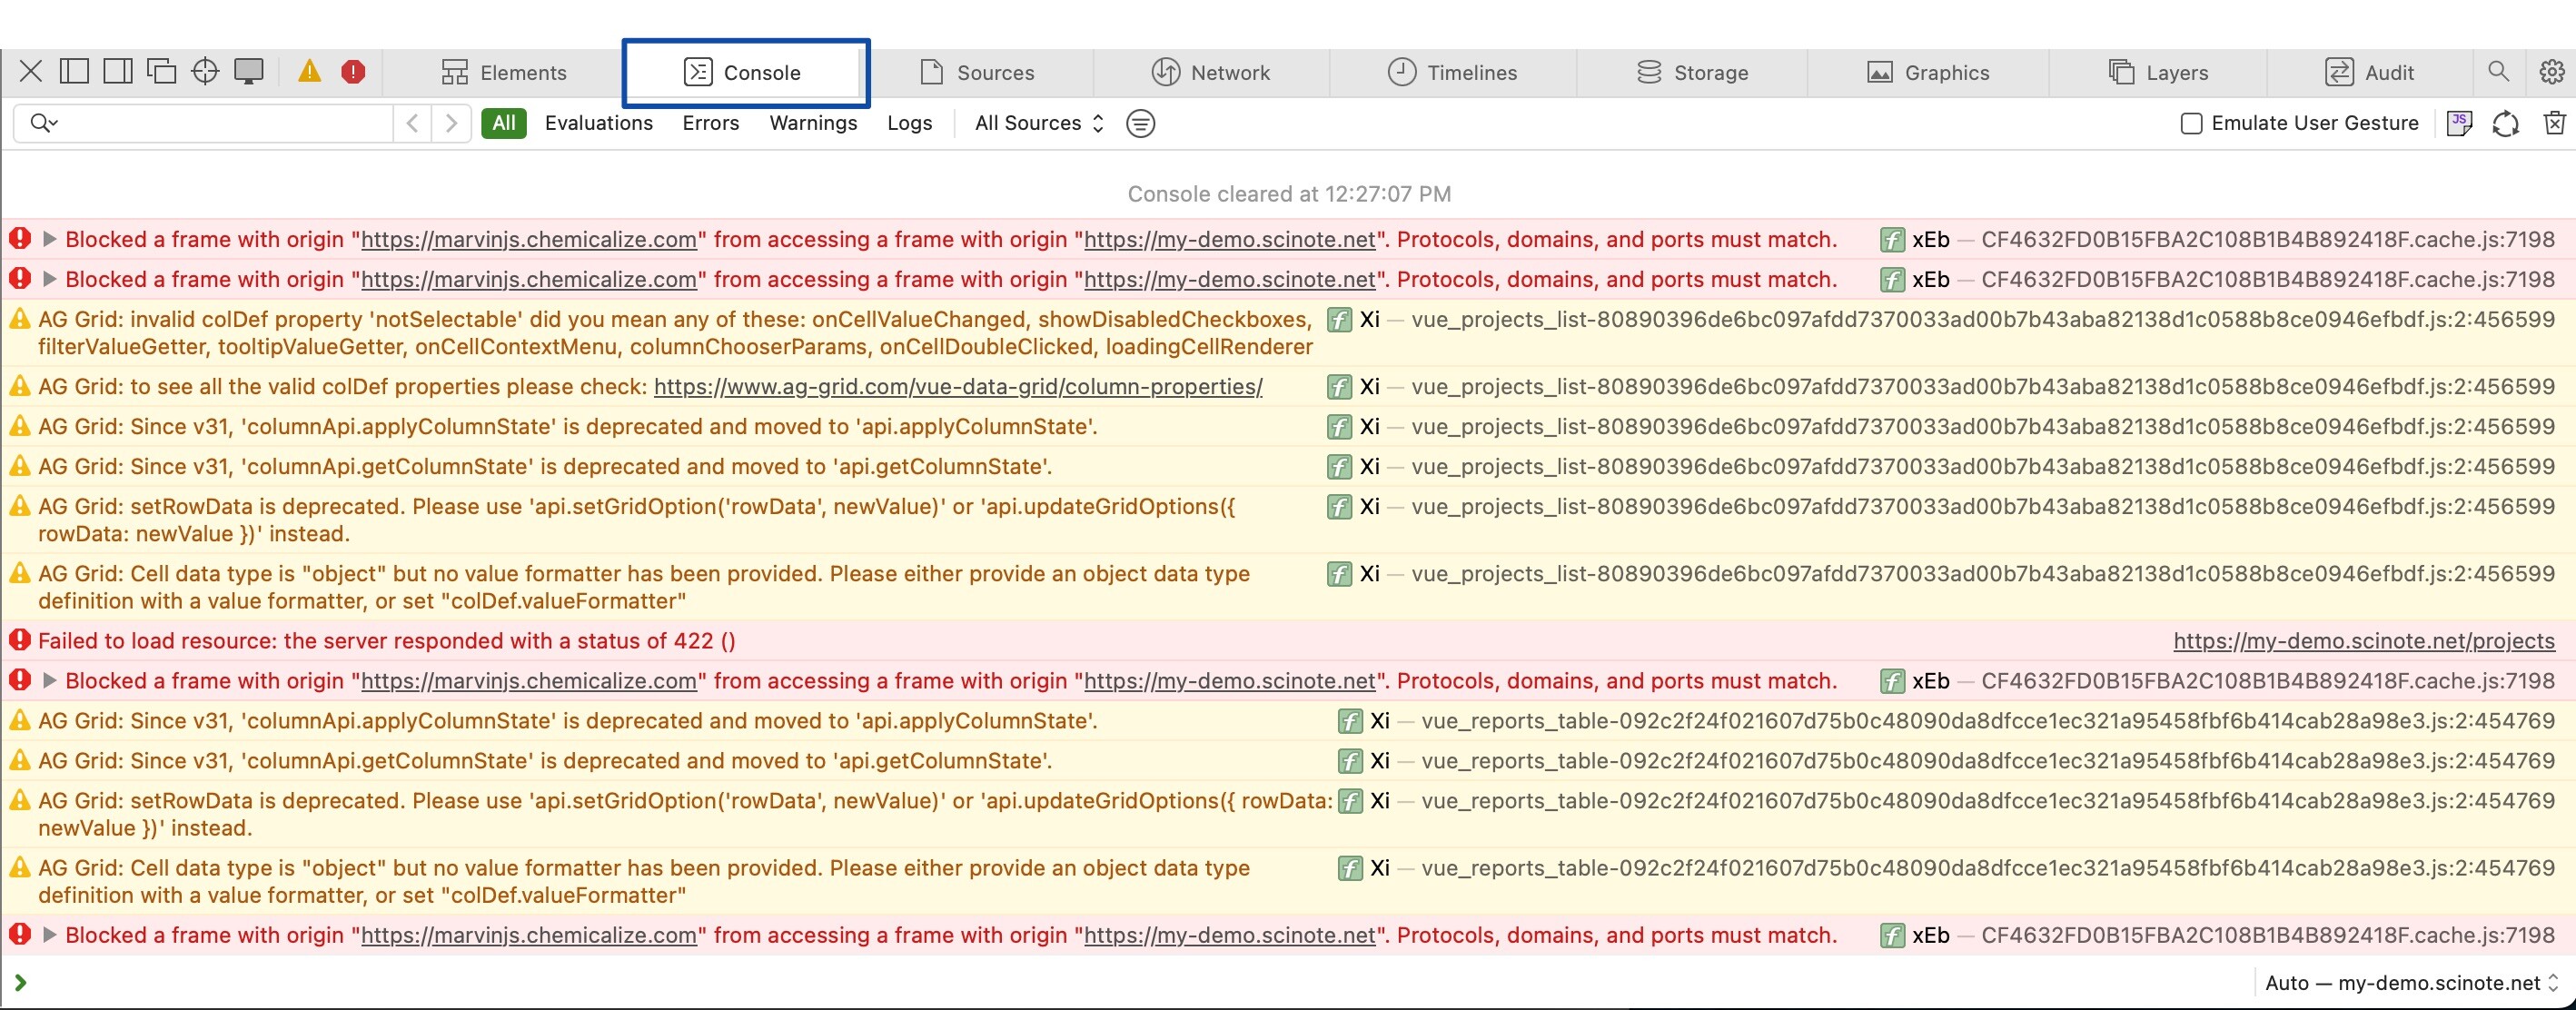
- Navigate to the Console tab in the console window and provide us a video/screenshot of the logs:

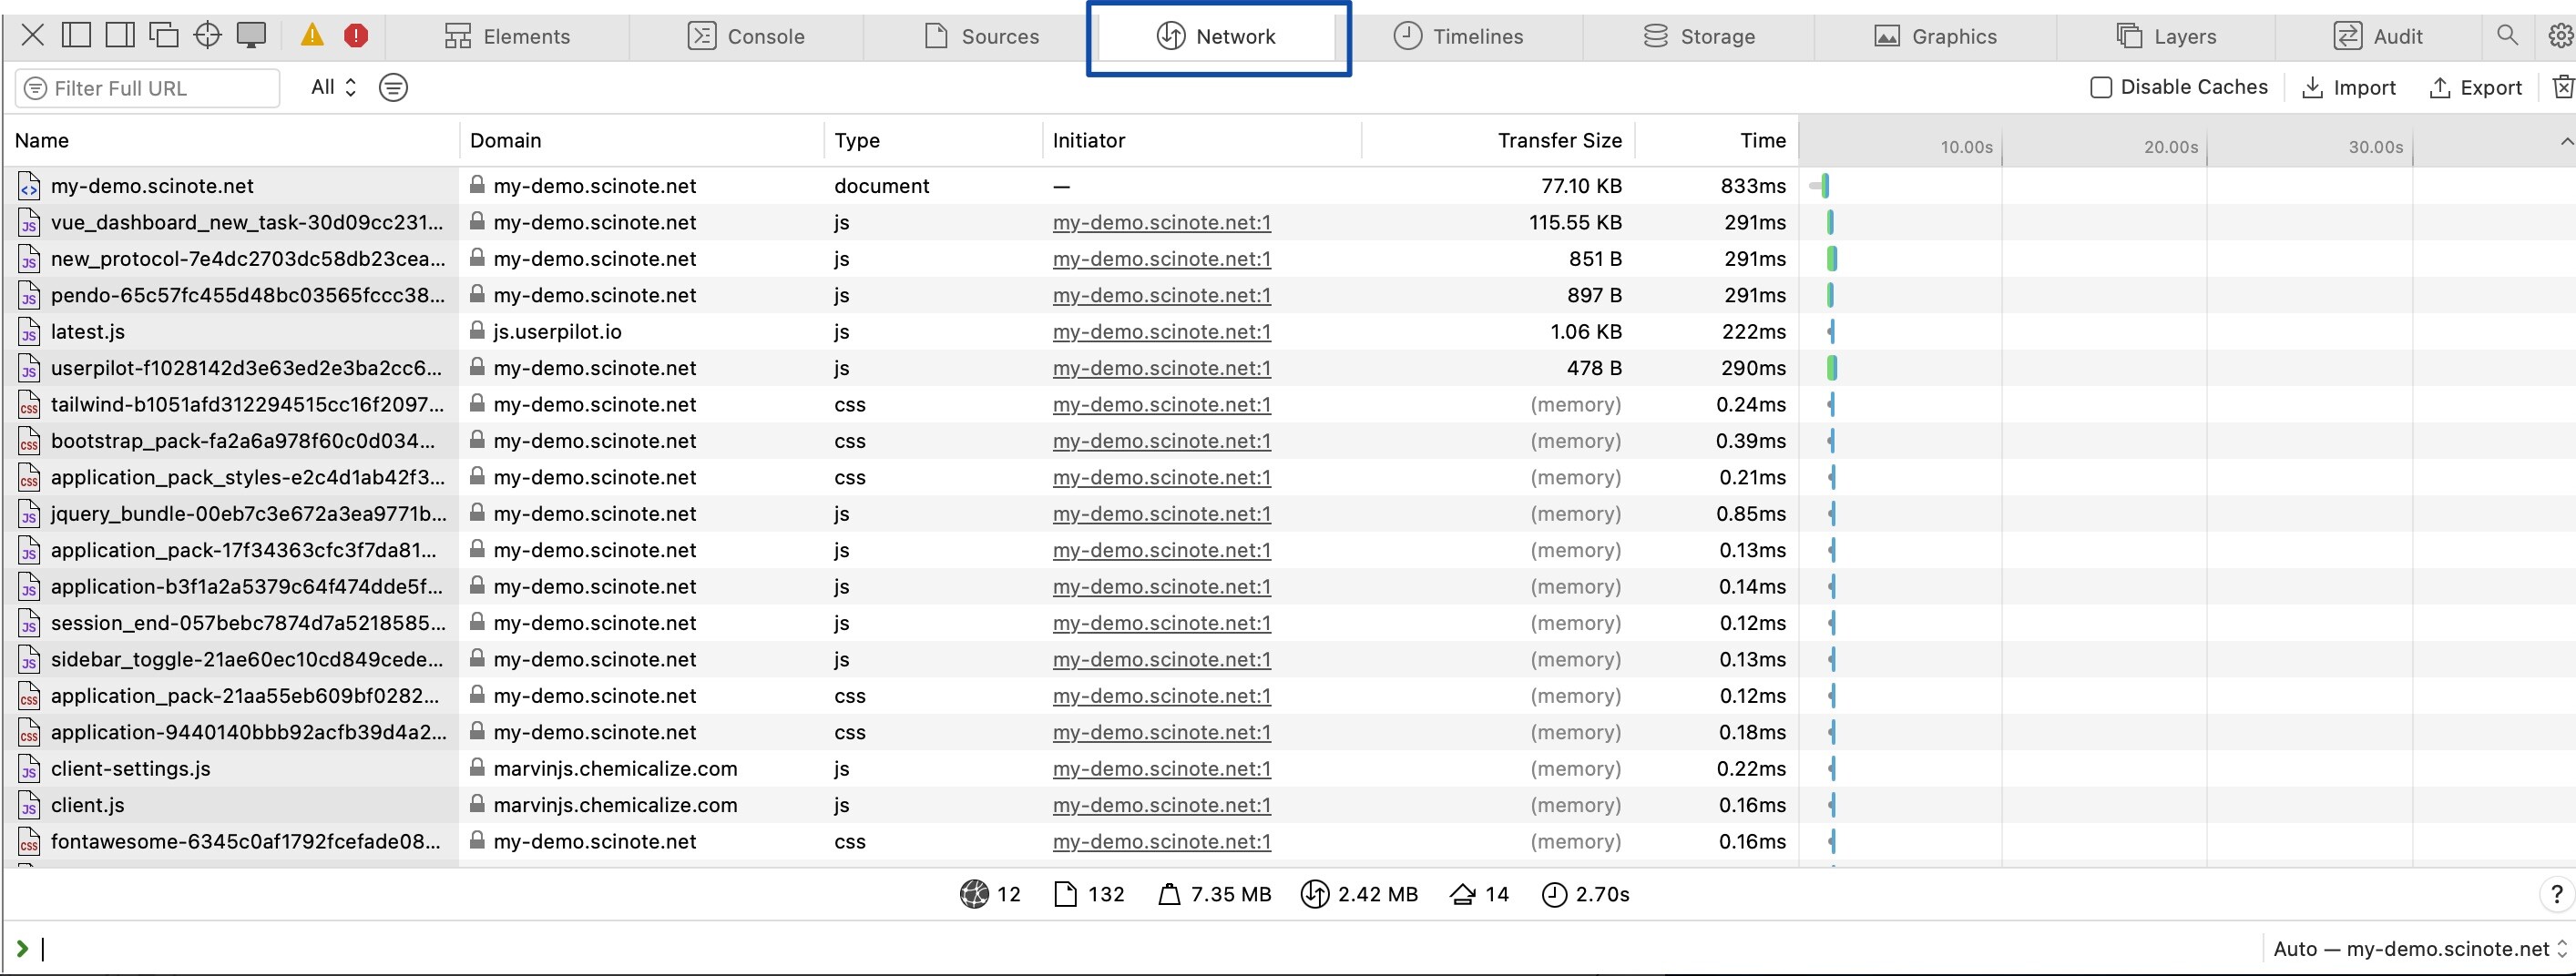
- Navigate to the Network tab in the console window and provide us a video/screenshot of the logs. You can also resize the window to capture as many logs in the screenshot as you can.

Microsoft Edge:
- Open browser console by navigating to
 Menu button in the upper righthand corner and clicking on More tools and then opening Developer Tools. (You can also use keyboard shortcut by holding down Ctrl+Shift and then pressing letter i.)
 - When (after) the console windows is open, then start your video recording and try to replicate the steps that bring you up to the issue in SciNote. Console logs should be now gathered in the background.
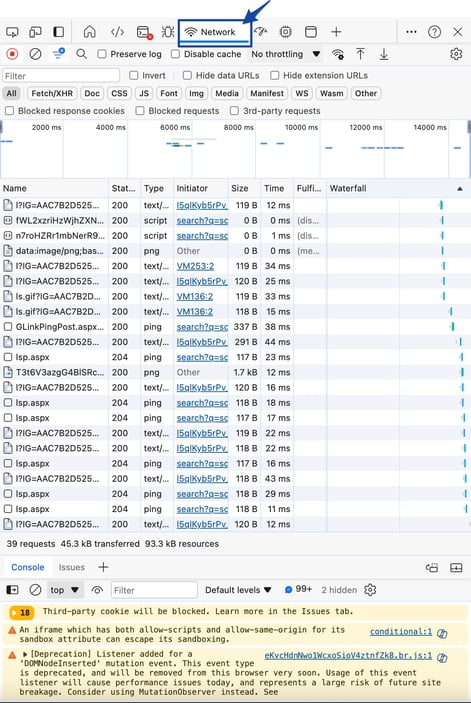
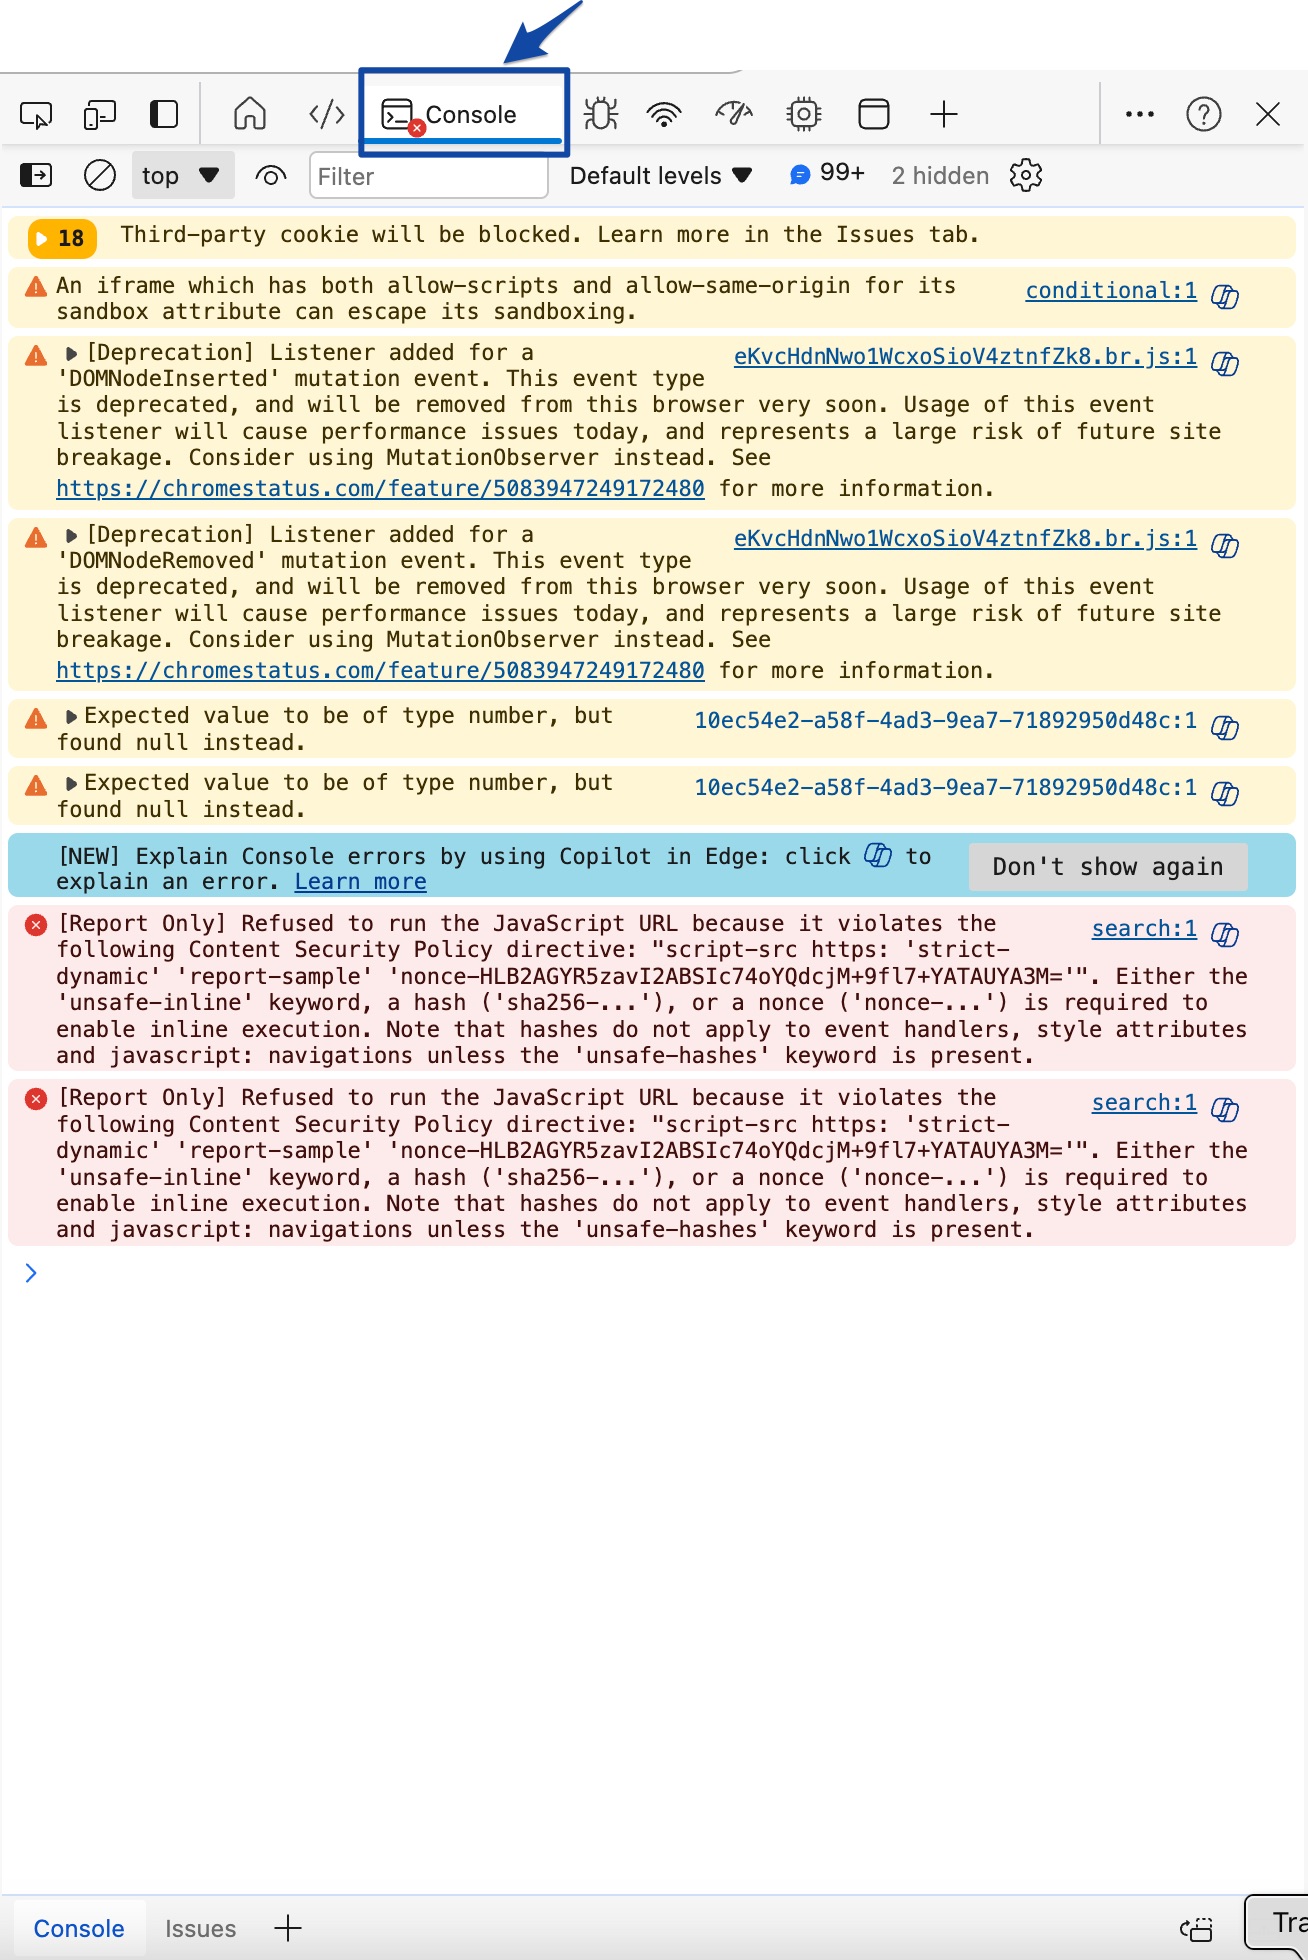
- Navigate to the Console tab in the console window and provide us a video/screenshot of the logs:
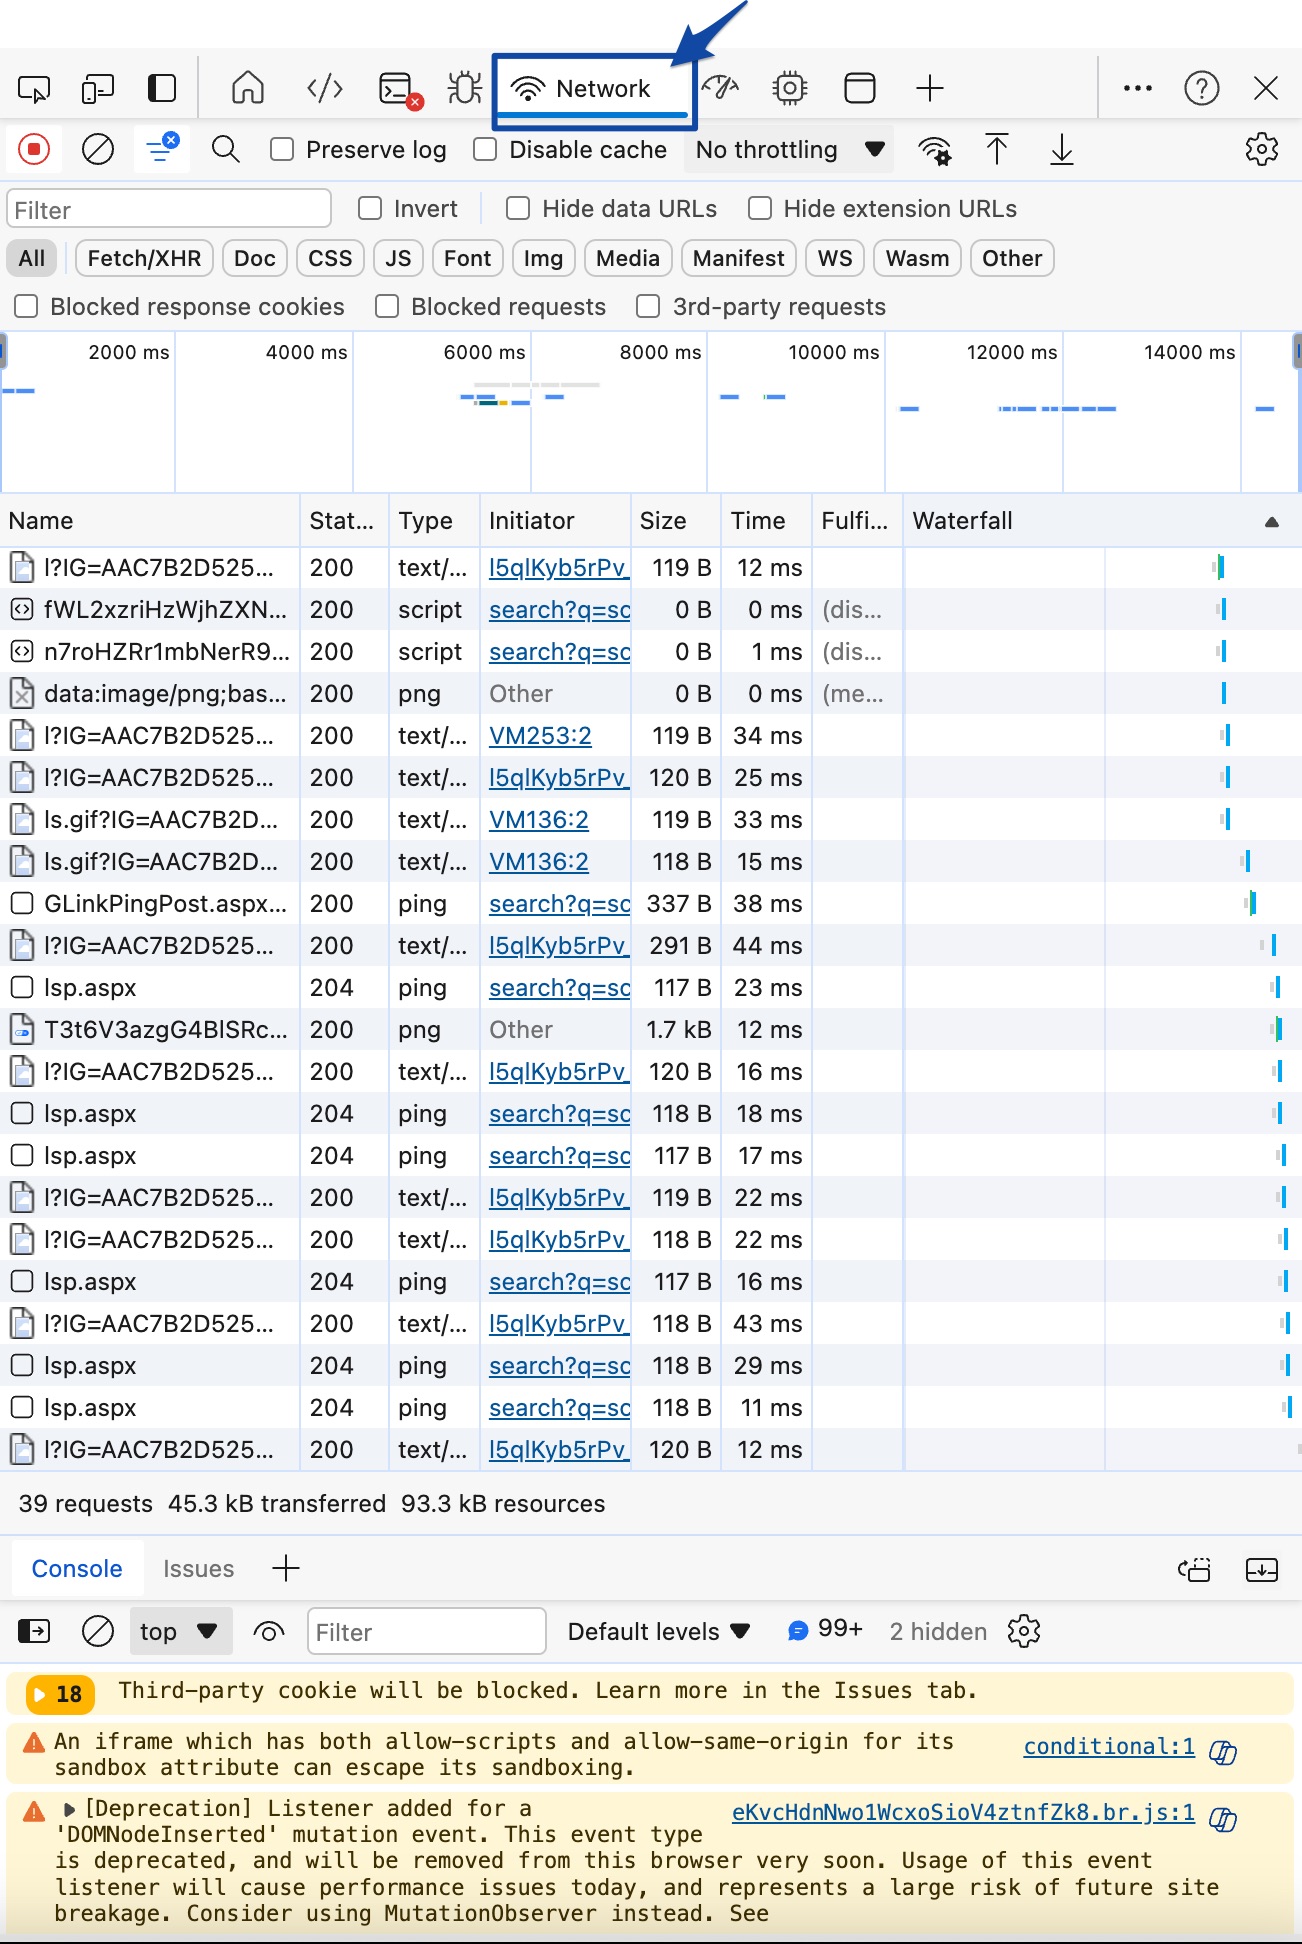
- Navigate to the Network tab in the console window and provide us a video/screenshot of the logs. You can also resize the window to capture as many logs in the screenshot as you can.