What's New?
SciNote introduced several key fields and visual indicators within Projects and Experiments, giving teams better visibility and control over your work.
💡 New Fields for Project Planning & Tracking
You’ll now find the following fields available directly on each Project and Experiment:
-
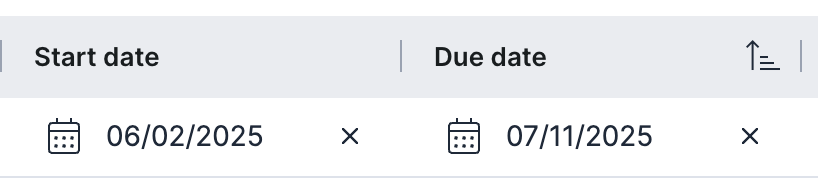
Start Date & Due Date
-
Define your project timeline and monitor milestones or delays.

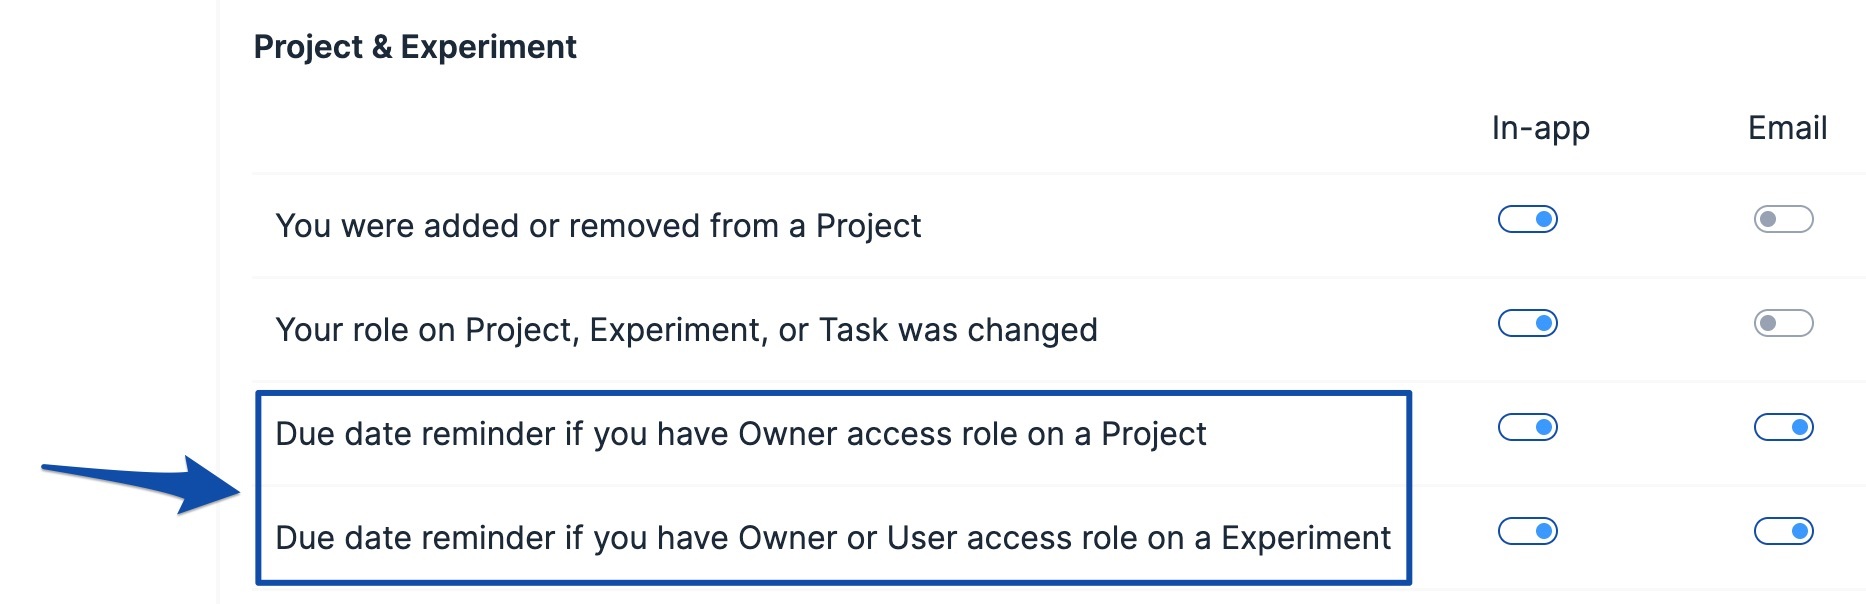
- *Tip – Update your Notification Settings to receive automatic notifications about upcoming Project Due Dates
-
-
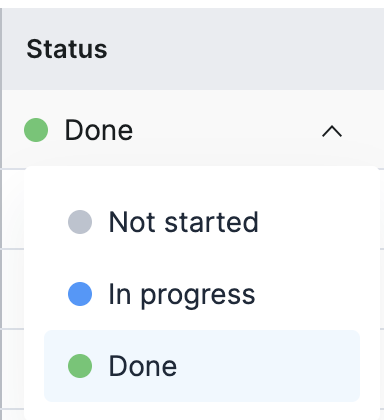
Status
-
Choose from Not Started, In Progress, or Done to easily track progress at a glance.

-
-
Head of Project (Projects only, NOT at the Experiment level)
-
Assign the lead scientist or owner of the project for clear accountability.
- Only 1 user can be assigned as the Head of Project

-
-
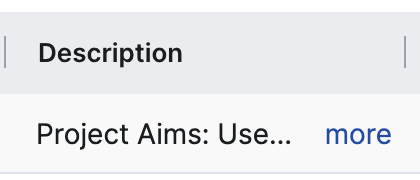
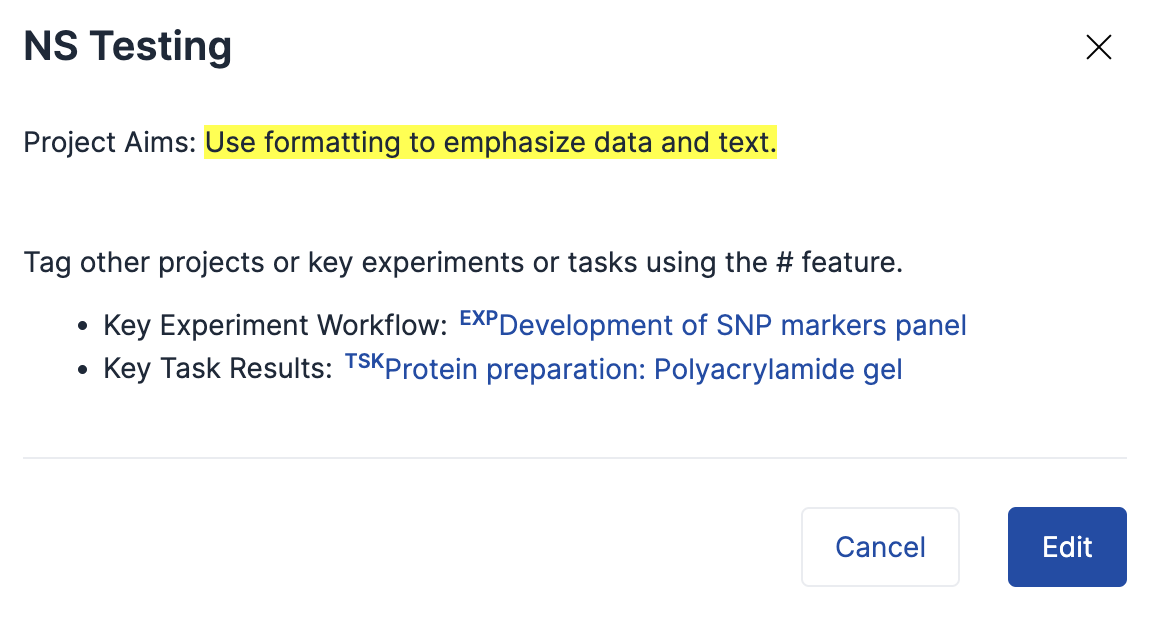
Description
-
Add a clear overview of the project’s scope, objectives, or special notes using an editable rich-text field with smart annotations.

- Click more to view the full Project Description field

-
All project and experiment fields are:
- Editable directly from the table view or within project details (with the appropriate user access role permissions)
- Searchable and filterable within the data tables themselves.
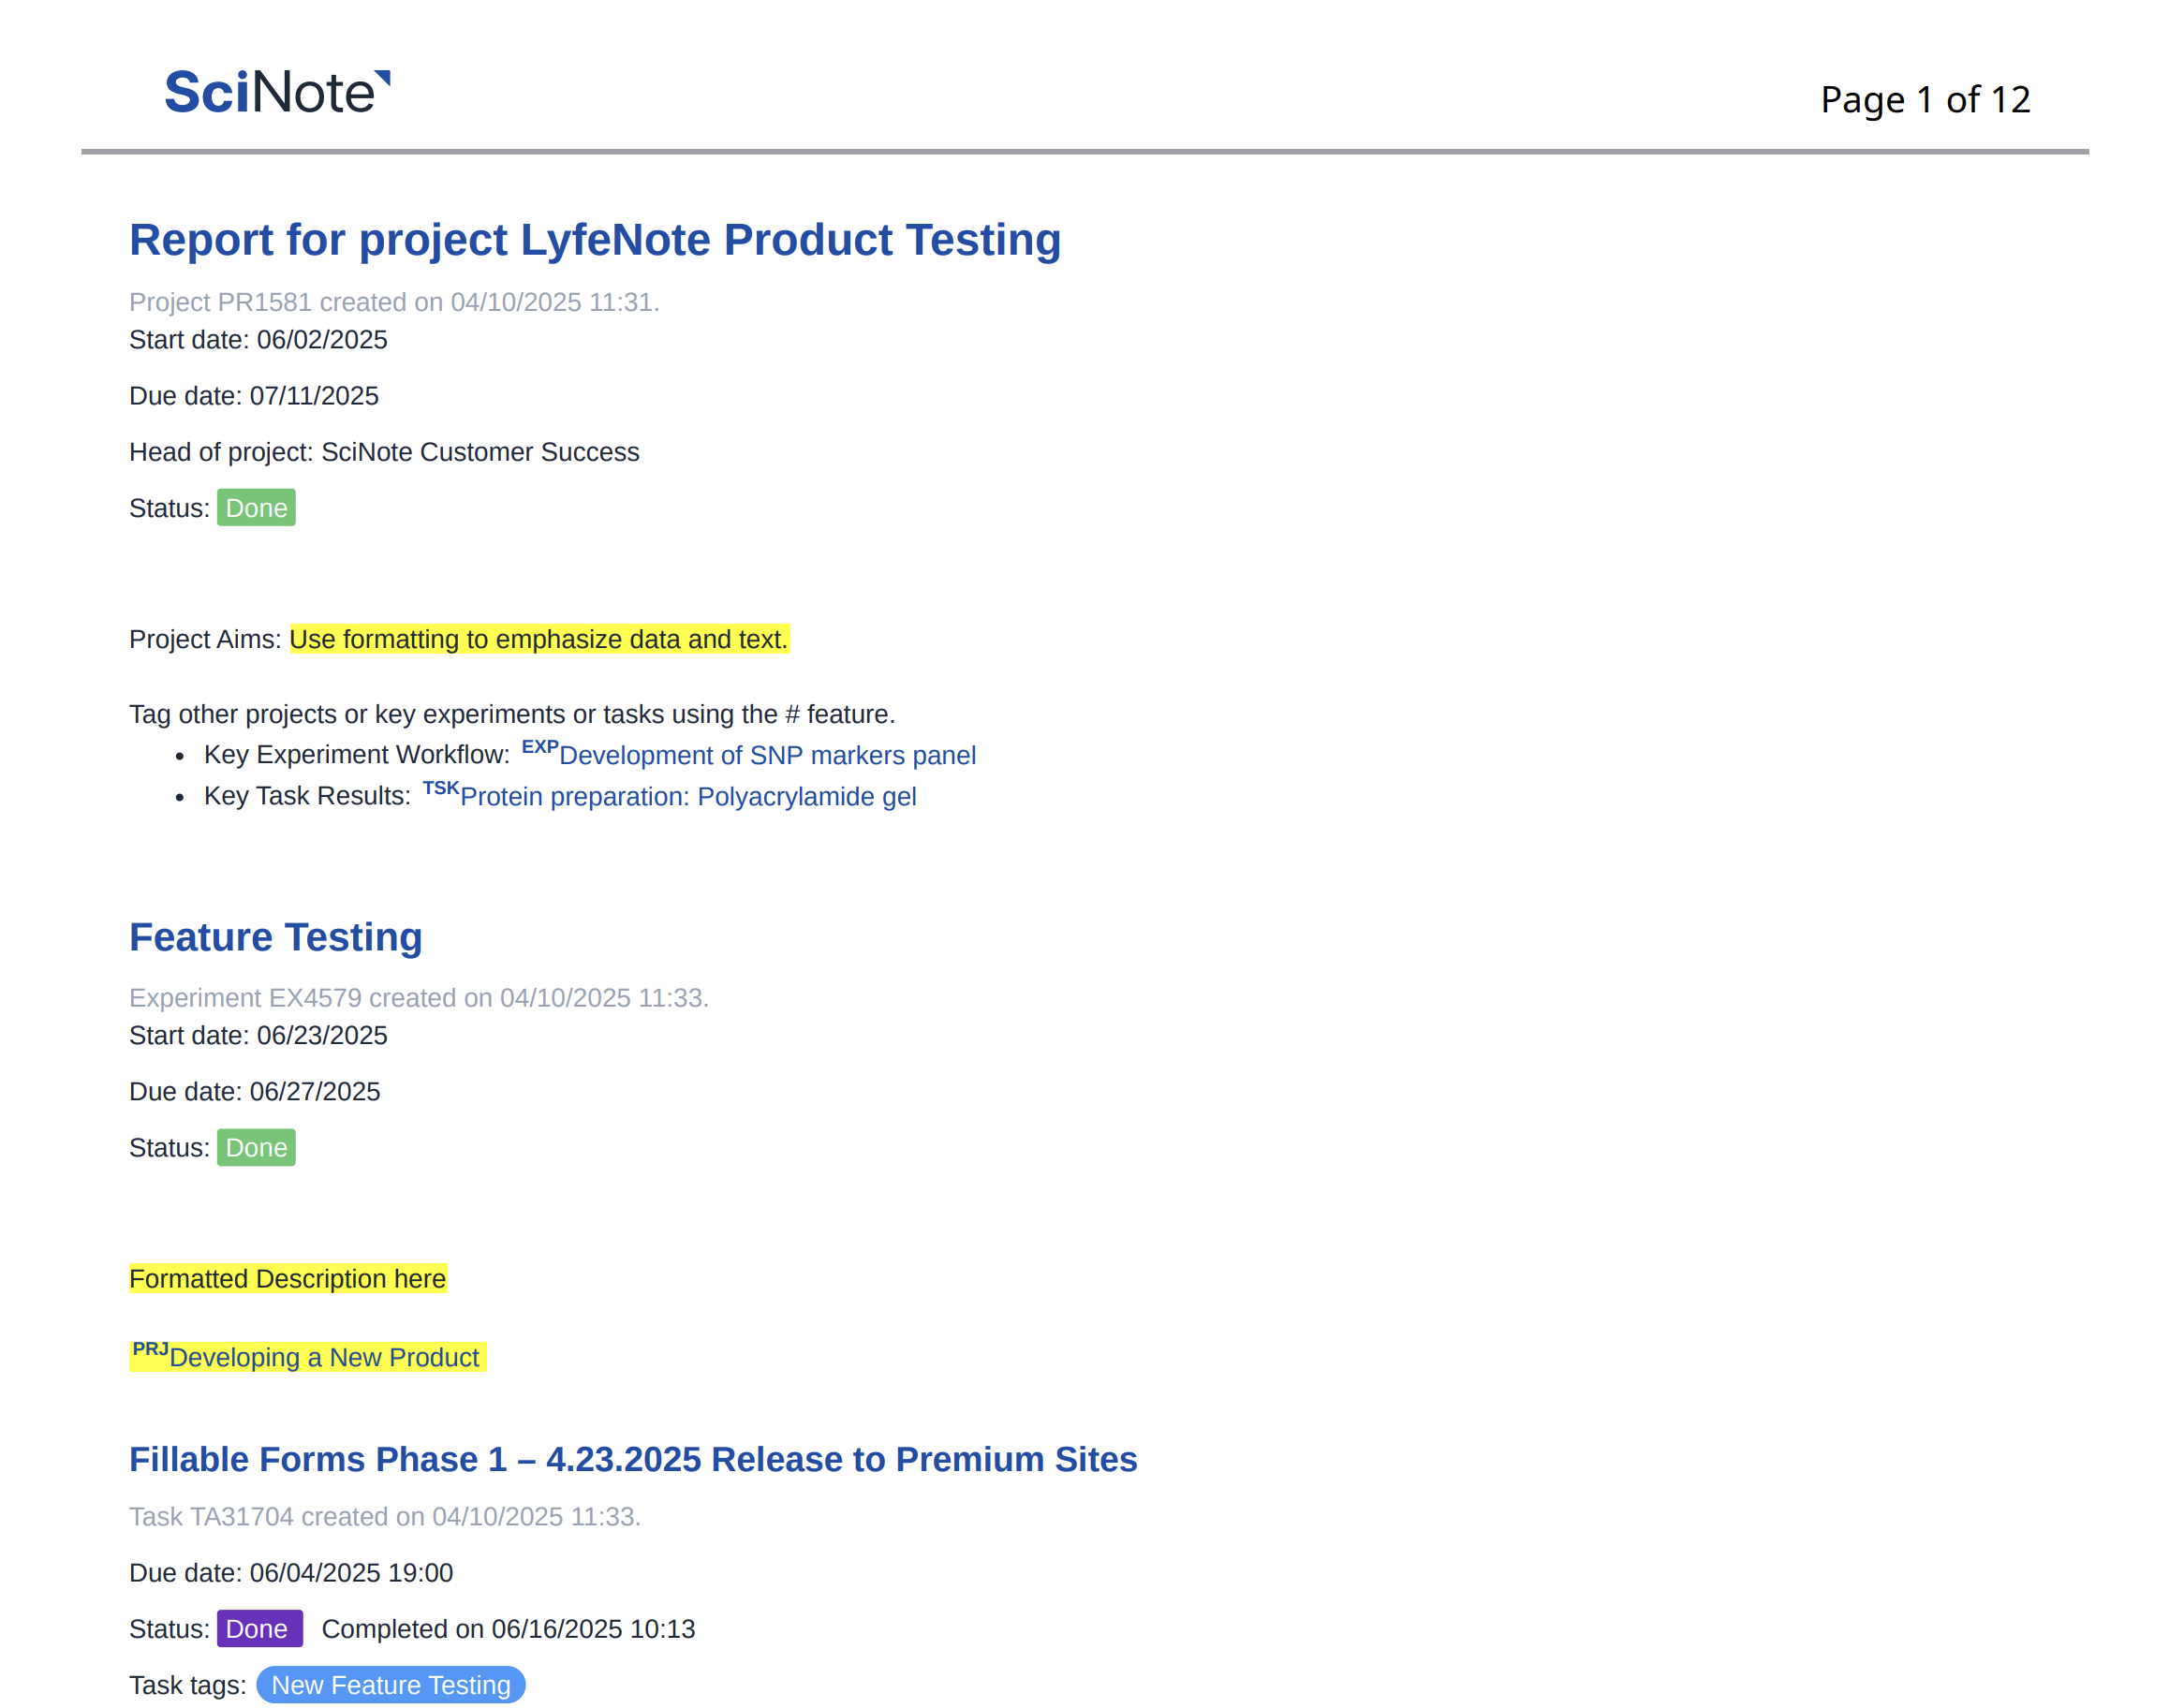
- Included in project exports and SciNote reports (PDF report example below).
✅ Improved Progress Tracking with “Experiments Done” & “Tasks Done” Columns
Gain visible insight into how much work within a project is completed with two new columns in the Project table view: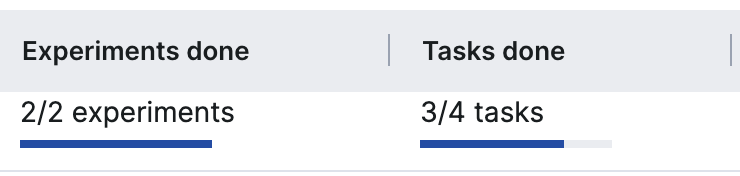
'Experiments Done'
- Shows the number of completed experiments vs. total.
- Corresponds to how many Experiments are marked as 'Done' in the Experiment 'Status' column
'Tasks Done'
- Shows the number of fully completed tasks vs the total within the total Project.
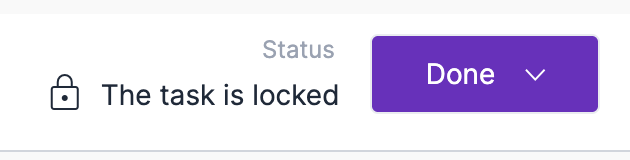
- For teams using task e-signatures / CFR compliance feature set, this column relates to the number of Tasks that are fully signed and marked in the 'Done' (purple) Task Status
-
- For teams not enabled with SciNote E-Signatures, the 'Tasks Done' column corresponds to all the Tasks marked in the 'Completed' Status.
- For teams not enabled with SciNote E-Signatures, the 'Tasks Done' column corresponds to all the Tasks marked in the 'Completed' Status.

This allows at-a-glance understanding of project progress, keeping team members informed and proactive.
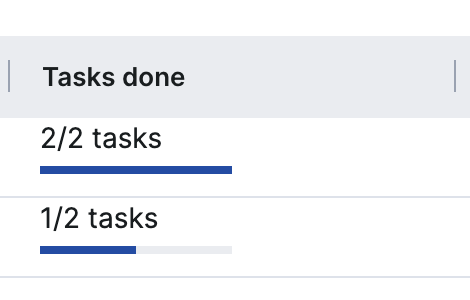
There is also a 'Tasks done' column within the Experiments table, which shows the same data for each individual Experiment workflow.
✉️ Enhanced Collaboration & Transparency
- Automatic notifications to project heads and team members for key updates.
- Use Favorites to quickly access high-priority Projects from your dashboard.
📘 Need Help brainstorming ideas for your Project structure?
Check out our High-level Project/Experiment/Task Data Structures or reach out to our support team for assistance.
If you have any additional questions, please contact us at support@scinote.net. For more information about the Premium plans, request a quote.